
XCT Insights
Stay Updated
Fullerene research, applications and company updates, delivered occasionally.
Latest from XCT
View all

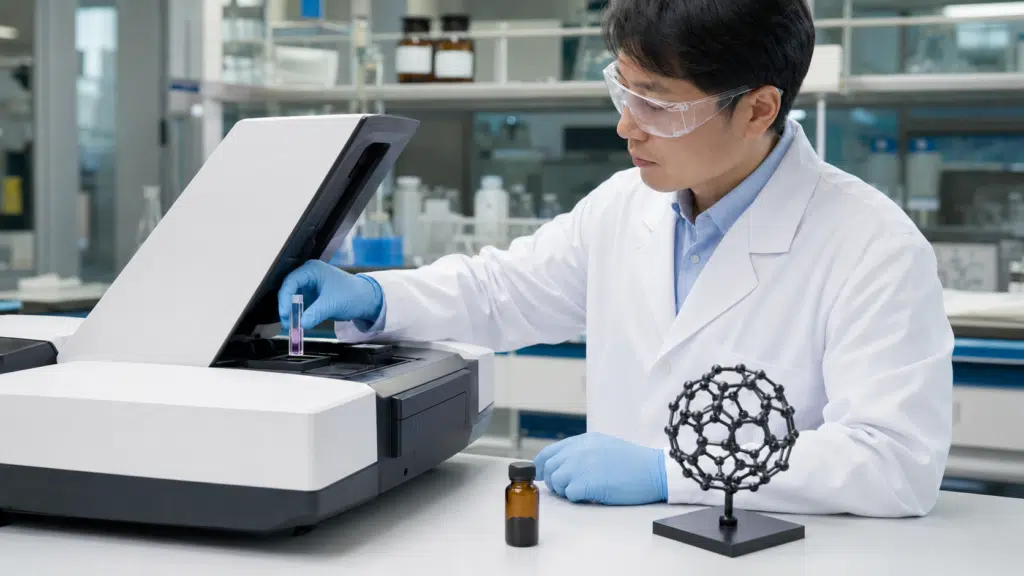
C60 UV–Vis spectroscopy provides a fast way to examine how buckminsterfullerene absorbs ultraviolet and visible light in a solution, dispersion, film, or material blend. The measurement can support molecular identification, reveal concentration-dependent behavior, compare processing conditions, and track changes introduced by solvents, aggregation, substrates, or surrounding materials.
The resulting spectrum is not determined by molecular identity alone. Solvent, concentration, optical path length, sample preparation, scattering, instrument baseline, film thickness, and interactions with other components can all change the observed curve. A reliable interpretation therefore begins with the physical state of the sample and the exact question the measurement is intended to answer.
UV–Vis spectroscopy measures how much incident light is absorbed or transmitted across a selected wavelength range. In molecular C60, absorption arises from electronic transitions associated with its conjugated carbon cage. The high symmetry of the molecule influences which transitions are strongly allowed and which appear as weaker features.
Early gas-phase work reported a narrow C60 ultraviolet absorption feature near 386 nm.[1] Solution measurements subsequently showed that the spectrum depends on the surrounding solvent. A study of C60 in 15 organic solvents found appreciable solvent-dependent shifts in bands around the approximately 330 and 405 nm regions.[2]
These values should be treated as literature regions, not universal acceptance limits. A spectrum collected in an aromatic solvent cannot be compared numerically with a gas-phase, solid-film, aqueous-colloid, or polymer-blend spectrum without considering the different molecular environments.
Pristine molecular C60 generally produces strong ultraviolet absorption together with weaker structure extending into the visible region. In commonly used organic solvents, researchers frequently examine:
The exact peak positions, relative intensities, and amount of visible structure depend on solvent, concentration, spectral bandwidth, instrument response, and sample state. A published peak list should therefore be used as a comparison aid rather than copied into a specification without matching the experimental method.
A spectrum consistent with C60 supports the presence of the expected electronic absorber. It does not by itself establish that the sample is a specified percentage of C60 by mass or chromatographic area.
A minor impurity may have weak absorption, overlap a C60 band, fall outside the scanned region, or remain below the practical sensitivity of the measurement. Conversely, baseline drift, solvent absorption, scattering, and high absorbance can distort a pure sample’s spectrum.
When the decision concerns the relative abundance of soluble fullerene components, HPLC is more directly aligned with the question. Mass spectrometry can support molecular composition, while Raman spectroscopy can examine characteristic cage vibrations. XCT’s guide to C60 characterization methods explains how these methods answer different analytical questions.
Sample preparation determines whether a measured spectrum represents a reproducible molecular solution or a mixture affected by undissolved particles and aggregates.
Pristine C60 has very low compatibility with water but dissolves in selected organic solvents. Aromatic solvents such as toluene are often used for solution spectroscopy because they can produce visibly homogeneous C60 solutions. Other solvents can have different dissolution behavior, ultraviolet cutoffs, safety requirements, and interactions with the fullerene cage.
The solvent must be suitable for both the material and the selected wavelength range. If the solvent absorbs strongly in the same region as the target transition, the usable spectral window becomes limited and blank subtraction becomes more sensitive to small mismatches.
Solvent choice also affects the spectrum itself. Gallagher and colleagues reported solvatochromic shifts across a set of organic solvents, including differences among aliphatic solvents, aromatic solvents, and carbon disulfide.[2] Comparisons across samples should therefore use the same solvent unless the solvent effect is the subject of the experiment.
A single highly absorbing solution gives limited diagnostic information. A dilution series is more useful because it tests whether absorbance changes proportionally with concentration and whether spectral shape remains stable.
Under conditions where the Beer–Lambert relationship applies, absorbance is proportional to molar concentration and optical path length:
A = εbc
where A is absorbance, ε is the molar absorption coefficient at the selected wavelength, b is the optical path length, and c is concentration.
If the absorbance stops increasing linearly, possible causes include excessive absorbance, aggregation, incomplete dissolution, stray light, concentration error, cuvette mismatch, or a chemical change in the sample. Repeating the measurement at lower concentrations helps separate an instrumental range problem from genuine concentration-dependent behavior.

The reference cuvette should contain the same solvent and any intentionally added matrix components used in the sample. A blank prepared from a different solvent batch or composition can introduce artificial slopes and offsets.
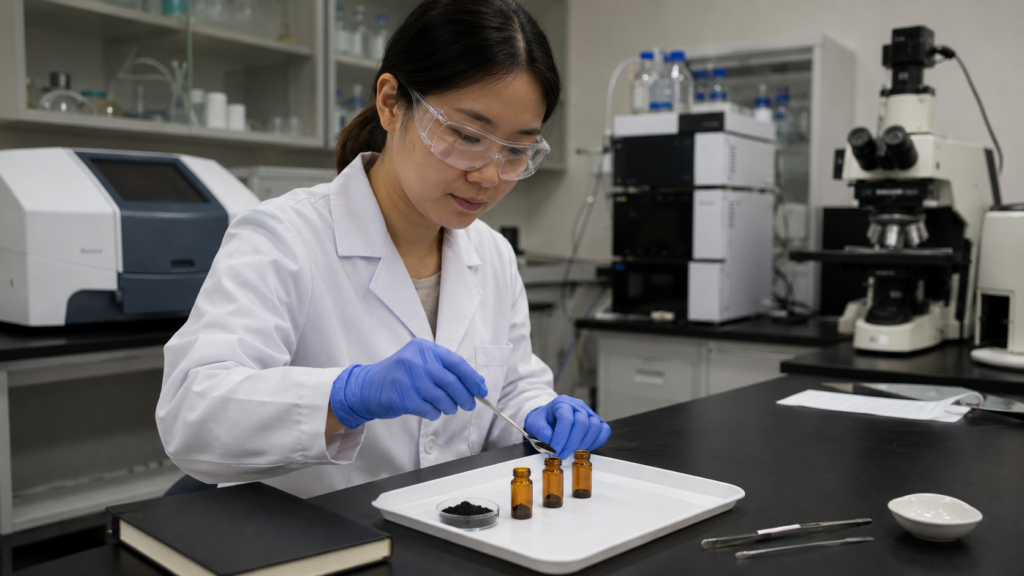
Quartz cuvettes are normally required when the scan extends into the ultraviolet. The optical faces should be clean, aligned consistently, and free of fingerprints, droplets, scratches, and bubbles. Handling the cuvette by its non-optical upper surfaces reduces avoidable variation.
A change in a C60 UV–Vis spectrum does not automatically indicate chemical degradation. The same molecular material can produce different spectra when its environment or physical state changes.
Solvent polarizability and solute–solvent interactions can shift transition energies and change band shapes. These effects are particularly important when comparing published peak positions obtained in different media.
Record the solvent identity, grade, preparation method, concentration, temperature, cuvette path length, and scan parameters. Without this information, a small wavelength difference cannot be confidently assigned to a change in molecular structure.
Aggregated or particulate C60 can broaden spectral features and add a wavelength-dependent background through light scattering. Research on aqueous nC60 has shown that UV–Vis behavior depends on the method used to prepare the colloidal suspension and on the resulting particle system.[3]
A steadily rising baseline toward shorter wavelengths, loss of fine structure, visible haze, or dependence on filtration and settling time can indicate that scattering contributes to the measurement. These observations should be investigated alongside particle-size or microscopy data when the system is intended to be a dispersion.
Filtration must also be interpreted carefully. A filter may remove dust and large aggregates, but it can adsorb fullerene material or selectively change the population being measured. Record the membrane material, pore size, and whether the sample spectrum changed after filtration.

For a fuller discussion of molecular solution versus dispersion behavior, see XCT’s guide to the solubility of pristine fullerenes in organic solvents.
| Observation | Possible explanations | Useful next check |
|---|---|---|
| Small wavelength shift | Solvent effect, calibration, temperature, matrix interaction, or chemical modification | Measure a reference under matched conditions |
| Lower absorbance than expected | Dilution error, incomplete transfer, adsorption, precipitation, path-length difference, or degradation | Prepare an independent dilution from the original sample |
| Nonlinear absorbance with concentration | Excessive absorbance, stray light, aggregation, incomplete dissolution, or concentration error | Extend the dilution series into a lower range |
| Broadening or loss of structure | Aggregation, matrix interaction, film-state effects, mixed species, or limited resolution | Compare solution, filtered sample, and complementary spectra |
| Sloping background | Scattering, blank mismatch, dirty cuvette, bubbles, or baseline drift | Repeat the blank and inspect the sample visually |
| New absorption feature | Derivative formation, oxidation, photochemical change, contaminant, or surrounding material | Use HPLC, MS, Raman, or another structure-sensitive method |
The interpretation should follow the observation rather than assume one cause. For example, a lower absorbance after storage could reflect precipitation onto the container wall rather than destruction of the carbon cage. Examining the container, redissolving the sample under controlled conditions, and comparing an independently prepared solution can distinguish these possibilities.
A C60 film does not reproduce the spectrum of a dilute molecular solution. In a solid layer, molecules interact with neighboring C60 cages, the substrate, and adjacent materials. Film thickness, morphology, crystallinity, deposition conditions, annealing, oxidation, and optical interference can all affect the observed response.
For a film measurement, the reference should normally include an equivalent uncoated substrate. When C60 is deposited on a multilayer stack, the baseline may need to account for every underlying layer that contributes absorption, reflection, or interference.
Transmission alone is not always equivalent to absorption. Reflection and scattering can be significant, particularly for rough, thick, porous, or composite films. If an absorption coefficient is required, the optical model should match the actual sample geometry and include thickness information rather than treating raw absorbance as an intrinsic material constant.
UV–Vis can be valuable for comparing films produced under controlled process variations, but it does not independently identify the cause of every change. C60 Raman spectroscopy can examine molecular vibrations and some processing-induced structural changes, while C60 XRD evaluates long-range crystalline organization. Surface-sensitive questions may require C60 XPS analysis.

UV–Vis can be used to estimate C60 concentration when the system has been validated for that purpose. The measurement requires an appropriate wavelength, known path length, verified concentration standards or a suitable absorption coefficient, a stable solvent system, and a concentration range that follows Beer–Lambert behavior.
The calibration should be specific to the solvent, sample form, and instrument conditions. Applying an absorption coefficient reported in another solvent or for a different spectral feature can introduce systematic error. Likewise, a calibration developed for molecular C60 solution should not be applied directly to an aggregate dispersion or thin film.
For routine quantitative work, prepare multiple standards independently where practical, measure a solvent blank, inspect residuals from the calibration, and include a quality-control sample that is not one of the calibration standards.
UV–Vis is most informative when it answers a defined material or process question. A synthesis laboratory may use it to follow depletion or formation of absorbing species. A coating team may compare solutions before deposition and films after processing. A quality laboratory may use a matched reference to detect an unexpected optical difference between samples.
Researchers requiring high-purity Fullerene C60 should specify the intended sample state, solvent or deposition method, required quantity, and analytical objective. XCT can review available material and analytical information for research and industrial evaluation without treating UV–Vis as a substitute for every composition, surface, or device-level measurement.
To discuss a material requirement, use the XCT request form and include the target C60 grade, quantity, application, destination, processing route, and analytical information needed by the project.
C60 generally shows strong ultraviolet absorption, a prominent transition in the low-300 nm region, a weaker feature around approximately 400 nm, and lower-intensity absorption extending into the visible region. Exact positions and shapes depend on solvent, concentration, sample state, and measurement conditions.
No. UV–Vis spectroscopy can support identification and comparison of C60-containing samples, but it does not independently establish a numerical purity. HPLC, mass spectrometry, elemental methods, or other analyses should be selected according to the impurity or specification being evaluated.
Solvent polarizability and solute–solvent interactions can shift C60 electronic transitions and alter band shape. Meaningful comparisons should therefore use the same solvent and matched measurement conditions unless solvent effects are the subject of the experiment.
Aggregation can broaden absorption features, change relative intensity, and add a sloping background through light scattering. Dilution, visual inspection, filtration controls, and particle-sensitive methods can help distinguish aggregation from a molecular or chemical change.
Yes, when the solvent, wavelength, path length, calibration, and concentration range have been validated and the sample follows Beer–Lambert behavior. A calibration for molecular C60 solution should not be transferred directly to a dispersion or thin film.
For B2B procurement of Fullerene C60 (Pure), 99.95% Purity, No metallic residue, buyers should confirm target purity, required quantity, application, destination country, COA, MSDS/SDS, packaging, storage conditions, and shipping requirements before requesting a formal quotation.
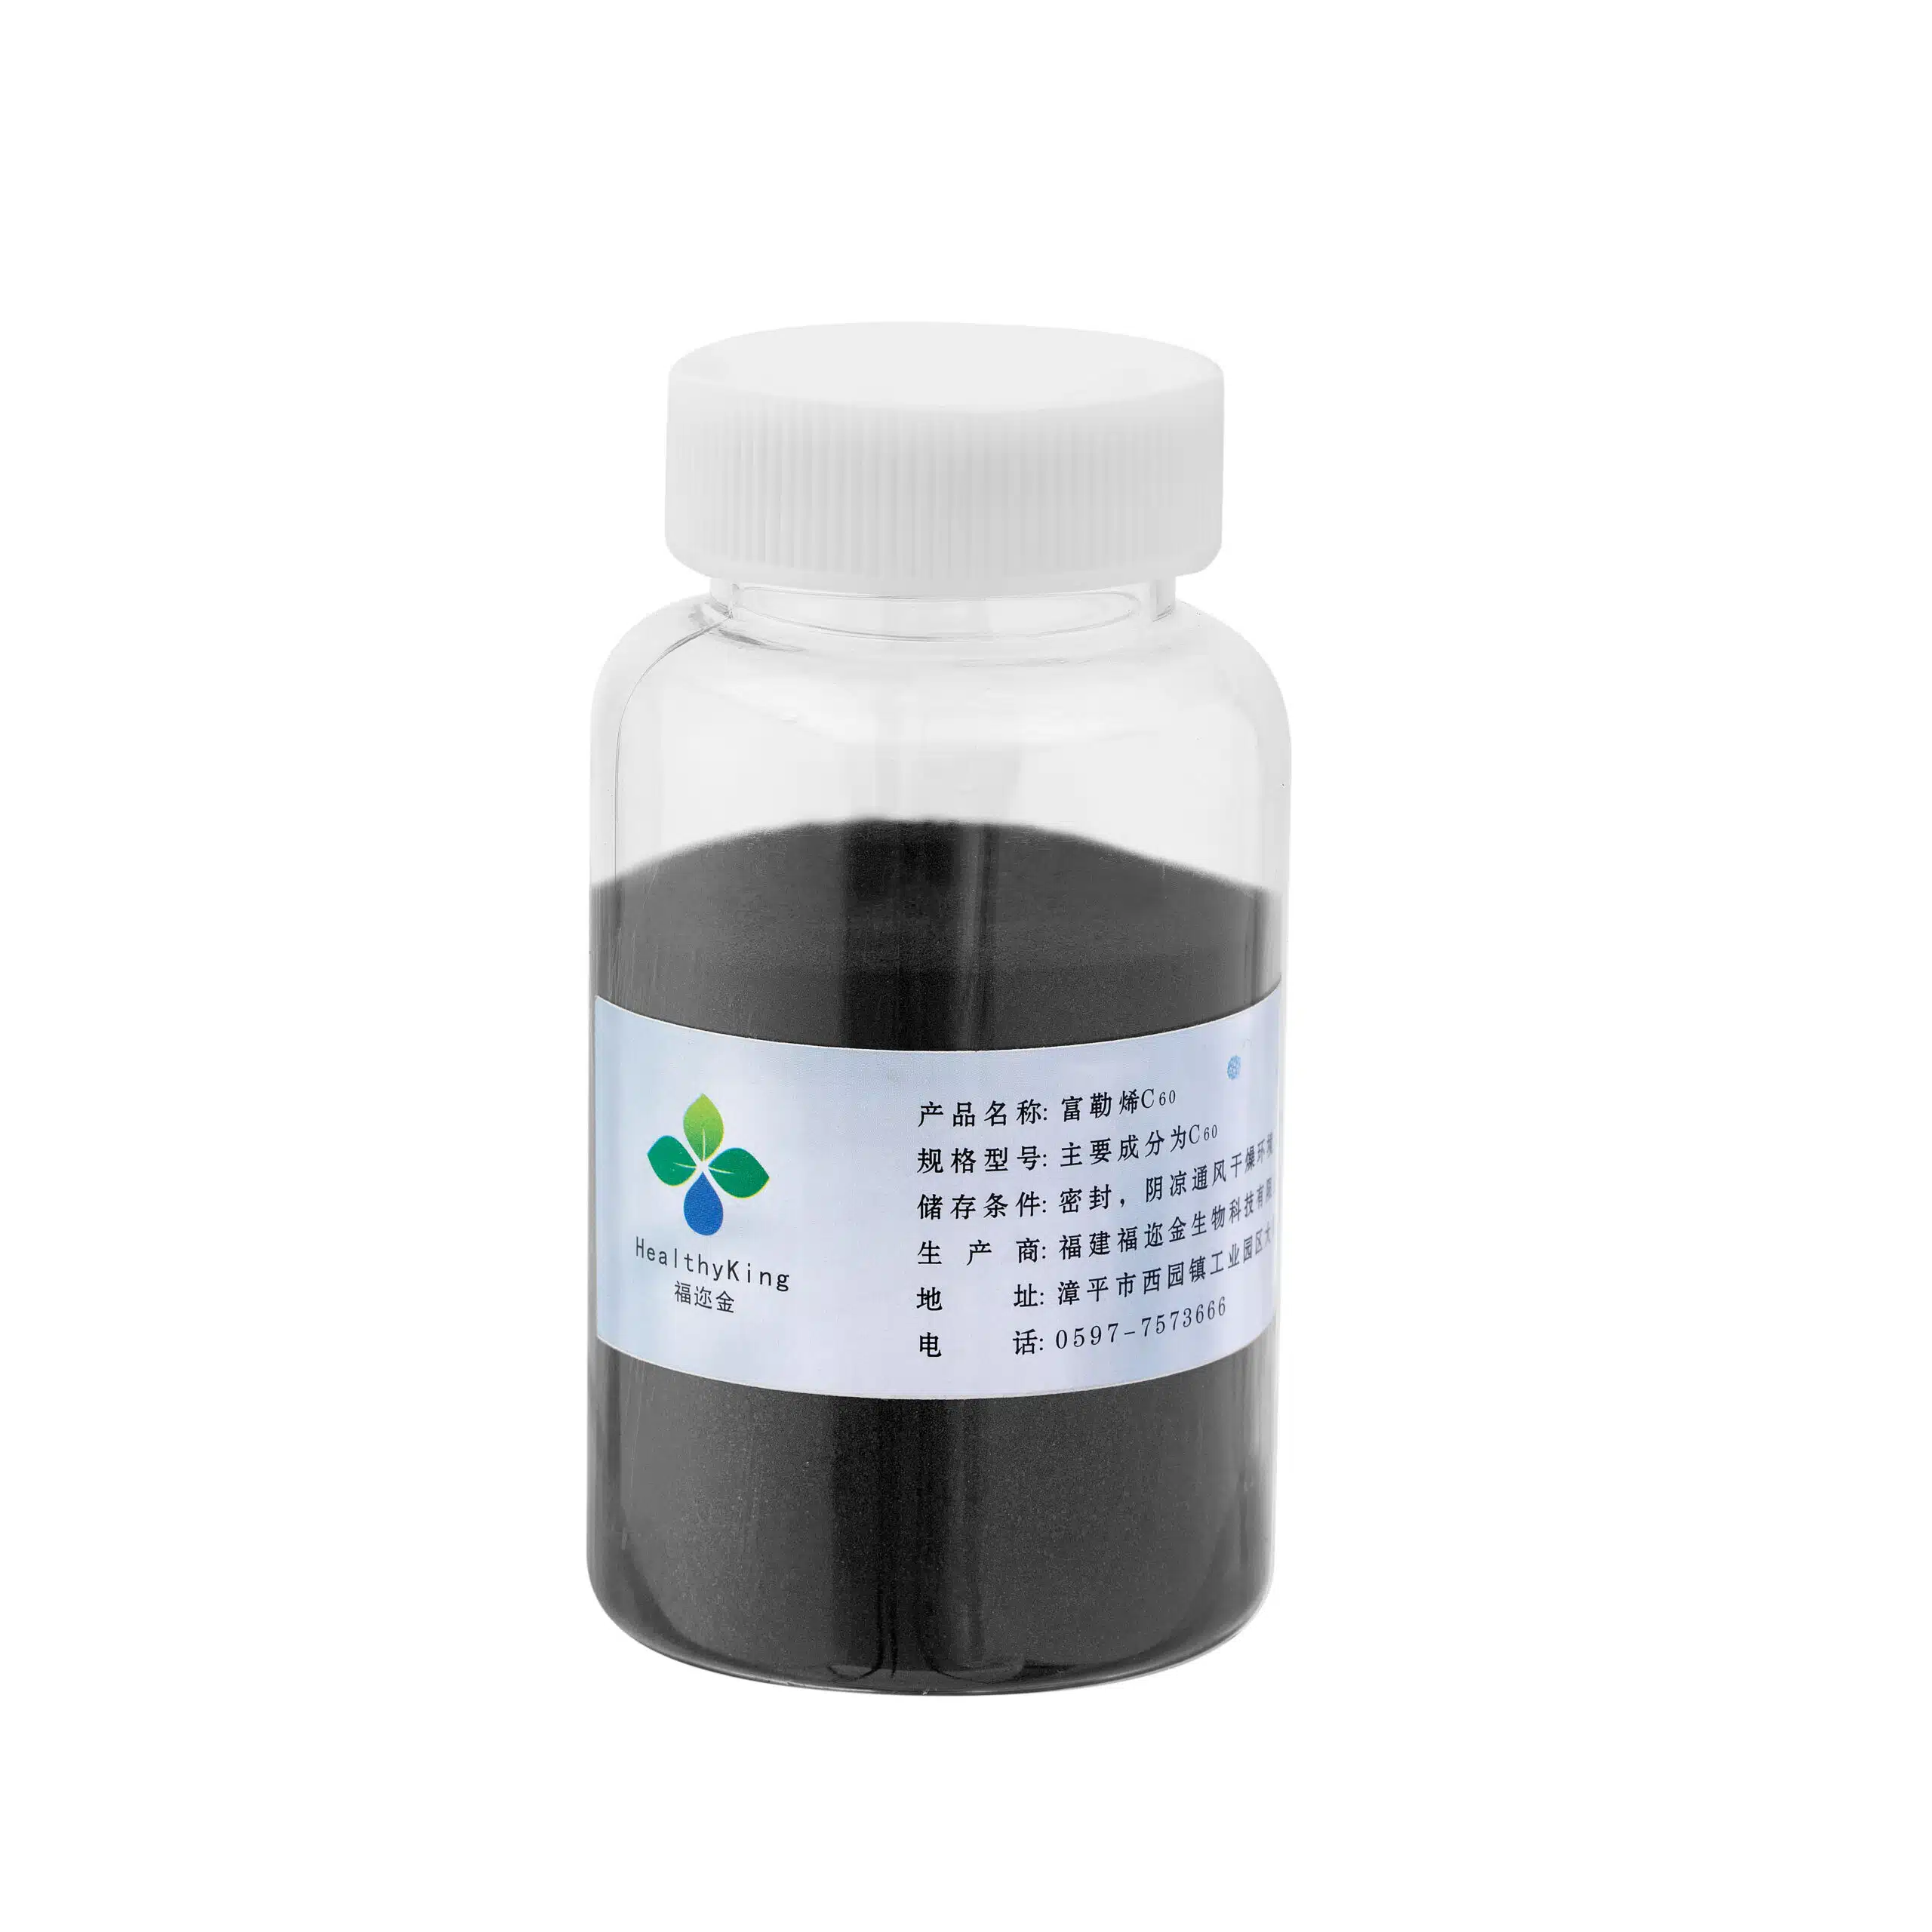
High-purity fullerene C60 is a highly refined nanomaterial designed specifically for the most demanding scientific and industrial applications. This ultra-pure form ensures…
Request product specifications, batch-specific COA, MSDS/SDS, sample availability, packaging details, and international shipping information before confirming your order.
Request DocumentsSubmit your product, purity, quantity, application, destination country, and documentation requirements. Our team will help confirm availability, COA, MSDS/SDS, packaging, and quotation details.