
XCT Insights
Stay Updated
Fullerene research, applications and company updates, delivered occasionally.
Latest from XCT
View all

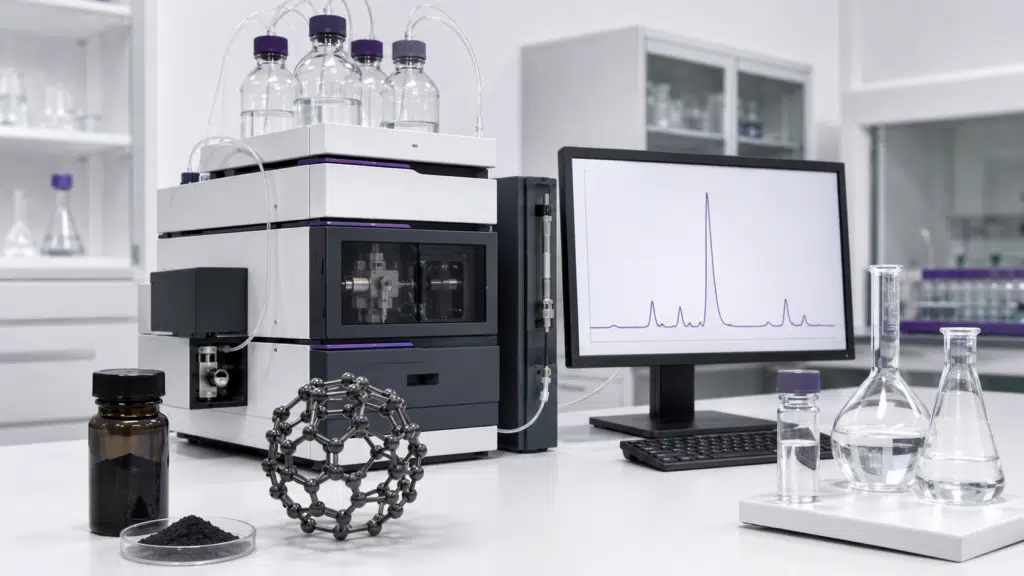
High-performance liquid chromatography, usually abbreviated as HPLC, is one of the most widely referenced methods for evaluating the purity of Fullerene C60. A supplier may report 99.0%, 99.5%, 99.9%, or 99.95% C60 and identify HPLC as the test method. The percentage appears precise, but the number cannot be interpreted properly without understanding how the sample was prepared, separated, detected, and calculated.
An HPLC chromatogram can provide powerful evidence about chromatographically detectable components in a C60 sample. It can separate C60 from C70, higher fullerenes, certain fullerene derivatives, and other compounds that respond under the selected detection conditions. It does not automatically measure every possible contaminant, nor does one large peak prove the absence of residual solvent, metals, moisture, soot, inorganic material, or compounds that are not detected by the method.
This guide explains what C60 HPLC purity means, how to interpret a chromatogram and why laboratories should evaluate the method behind the percentage rather than treating the purity number as a universal property of the material.
C60 is commonly produced alongside other carbon species. Depending on the production and purification process, the mixture may contain C70, higher fullerenes, fullerene-related by-products and non-fullerene material. Because several fullerene species have closely related structures and physical behavior, separating them is a central analytical and purification challenge.
Liquid chromatography is particularly useful because fullerene molecules can interact differently with a stationary phase and therefore leave the column at different retention times. Research has demonstrated HPLC separation of C60 and C70 using several stationary-phase and mobile-phase systems. One study using conventional reversed-phase columns found that C18 and C12 phases with relatively high surface areas could separate C60 from C70 and could also resolve unreacted C60 from fullerene derivatives in reaction mixtures.[1]
Other research has shown that changing the stationary phase can substantially change the resolution and retention of C60 and C70. In one comparison, a specially functionalized stationary phase produced different retention times and better baseline separation than a conventional C18 phase under the tested conditions.[2] These findings illustrate a fundamental point: an HPLC purity result is method-dependent. The column, mobile phase, flow rate, temperature, detector and integration rules all influence what the chromatogram reveals.
A chromatogram plots detector response against time. When a component leaves the column and reaches the detector, it produces a signal that appears as a peak. The time between injection and detection is its retention time under that particular method.
For a C60 sample, the principal C60 component should produce a dominant peak at the retention time established for C60 using the laboratory’s method. Other separated components may produce additional peaks. A chromatogram therefore provides three kinds of useful information: where components elute, whether they are adequately separated and how strongly the detector responds to each component.
Retention time alone is not an absolute molecular identification. It becomes more persuasive when the sample peak is compared with an authentic reference material under the same conditions or when chromatography is coupled with another identification technique. HPLC has, for example, been combined with ultraviolet-visible detection and Fourier-transform infrared detection to analyze and distinguish C60 and C70.[3] LC-MS can provide further molecular selectivity where the application requires it.
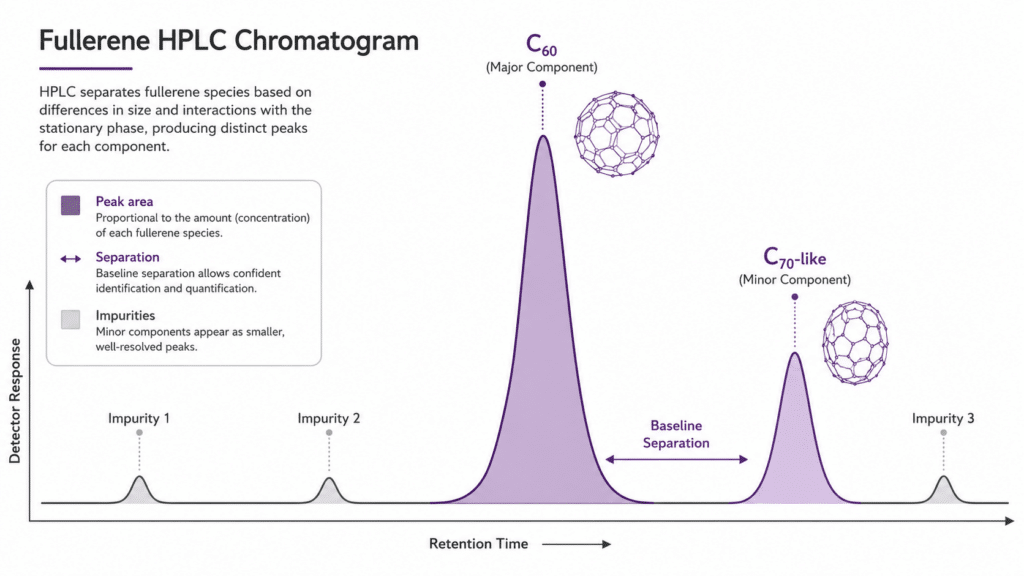
A reported C60 retention time is meaningful only together with the method conditions. It should not be copied from one laboratory’s chromatogram and applied to another instrument as a universal constant. Changing the column chemistry, solvent composition, gradient, flow rate or temperature can move the peak.
The area under a chromatographic peak represents the integrated detector response over the period in which that component elutes. Laboratories may calculate a relative area percentage by dividing the C60 peak area by the total integrated area of the included peaks.
This calculation is convenient, but a peak-area percentage is not automatically identical to mass fraction. It assumes that relevant components are eluted, detected, integrated and represented appropriately. It also requires consideration of detector response: equal masses of two different compounds do not necessarily produce equal signals at the selected wavelength. Analytical work using area normalization therefore depends on separation, detectability, linear response and appropriate response-factor assumptions.[4]
Peak height can help visualize signal strength, but area is generally more useful for quantitative evaluation. Peak shape also provides information about chromatographic performance. Severe fronting, tailing, splitting or unresolved shoulders may indicate method, column, loading, solvent or sample-related issues.
However, a visually symmetrical peak is not proof that it contains only one chemical species. Two components can co-elute and appear as a single peak if the method does not separate them. A supplier should therefore avoid claiming that a “sharp peak” alone proves complete chemical purity.
When a report uses chromatographic area normalization, the C60 area percentage may be expressed conceptually as:
C60 area percentage = C60 peak area ÷ total included peak area × 100
If the C60 peak represents 99.9% of the integrated detector response included in the calculation, the report may describe the sample as 99.9% by HPLC area. The qualification “by HPLC area” matters. It tells the reader that this is a chromatographic result produced under defined detection and integration conditions.
A rigorous report should explain which peaks were included, whether solvent or system peaks were excluded, how the baseline was selected and whether relative response factors were applied. If known impurities respond differently from C60 at the chosen wavelength, uncorrected area normalization can overstate or understate their concentration.
For an externally calibrated assay, the laboratory instead compares the sample response with standards of known concentration. This can support quantitative measurement, provided that the reference material, calibration range, sample preparation, linearity and method performance are suitable. The appropriate calculation depends on the analytical objective: identity, relative chromatographic purity, impurity quantification and total mass assay are not interchangeable questions.
A purity calculation is only as credible as the separation behind it. If C60 and an impurity overlap, the detector may integrate both responses as part of one peak. A result can then look numerically impressive even though the method lacks sufficient selectivity.
Researchers have reported materially different C60/C70 resolution when using different stationary phases and solvent systems.[2] Conventional columns can work effectively, but the method must demonstrate that likely fullerene impurities are separated under the selected conditions.[1]
When reviewing a chromatogram, the first question should therefore not be “How large is the C60 peak?” It should be “Can this method resolve C60 from the impurities that matter?” Useful supporting evidence may include a reference mixture, system-suitability results, resolution data, repeat injections or an impurity-spiking study.
Pristine C60 is insoluble in water and has strongly solvent-dependent solubility. An HPLC analysis therefore begins well before the sample reaches the column. The laboratory must select a solvent that dissolves the test portion adequately without causing degradation, precipitation or incompatibility with the chromatographic system.
If part of the sample does not dissolve, the injected solution may not represent the complete material. Filtration can remove particles, but it may also remove undissolved C60 or particulate impurities. Dilution, sonication, storage time, light exposure and solution stability can also affect the prepared sample.
A useful method record should identify the sample mass, solvent, final concentration, preparation procedure, filtration conditions and time between preparation and injection. This information is particularly important when two laboratories report different results for material from the same batch.
HPLC is not a universal detector of everything present in C60 powder. A chromatogram only shows compounds that enter the analytical solution, pass through the system and produce a response under the selected detector settings.
Depending on the method, HPLC may not adequately account for:
| Potential material | Why HPLC alone may be insufficient | Possible complementary approach |
|---|---|---|
| Residual organic solvents | They may be excluded with the solvent front or poorly represented by the selected detector. | Gas chromatography, such as GC or GC-MS |
| Trace metals | Metals do not necessarily produce a meaningful fullerene HPLC-UV peak. | ICP-MS, ICP-OES or another validated elemental method |
| Water | Water content is not established by a conventional fullerene HPLC area result. | Karl Fischer titration or another suitable moisture method |
| Insoluble carbonaceous material | It may remain outside the injected solution or be removed during filtration. | Gravimetric, thermal, microscopic or other material-specific analysis |
| Co-eluting compounds | They may be integrated within the apparent C60 peak. | Improved separation, diode-array assessment, LC-MS or orthogonal spectroscopy |
A multi-technique study of commercial C60 samples reached the same broader conclusion: purity evaluation depended on combining several solid-state, solution-phase and gas-phase methods, including RP-HPLC, GC-MS, UV-Vis, FTIR, thermal analysis and diffraction.[5] The study did not support treating HPLC as a complete description of every possible impurity in solid C60.
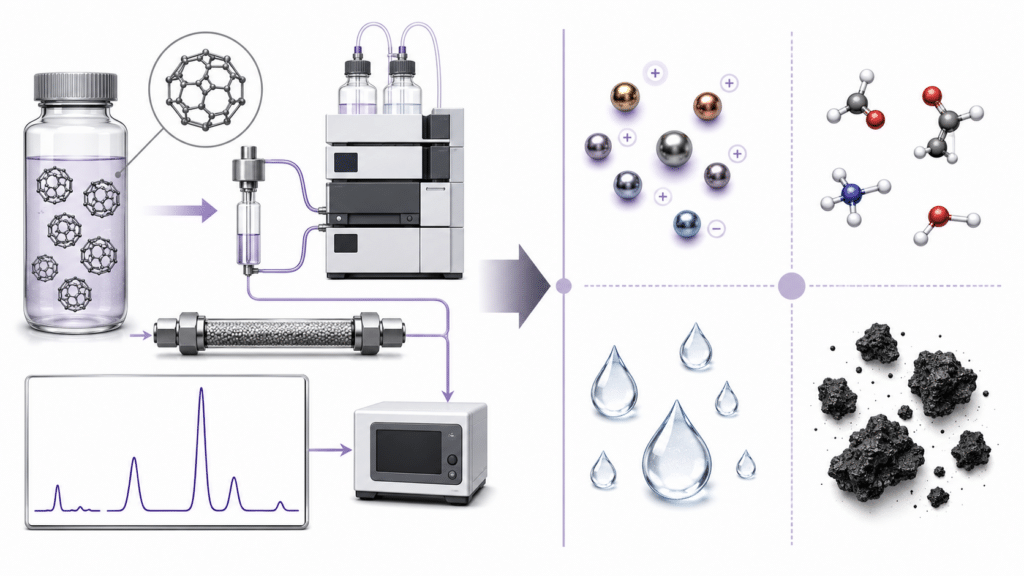
An analytical method should be appropriate for the decision it supports. International analytical-validation guidance describes validation as demonstrating that a procedure is fit for its intended purpose and identifies characteristics such as specificity, accuracy, precision, range and robustness as relevant depending on the analytical use.[6]
This does not mean every industrial C60 chromatogram must be developed as a pharmaceutical release method. It means that the laboratory should define what the method is intended to establish. A method used to distinguish C60 from C70 may require a different validation strategy from one used to quantify trace-level impurities or assign a high-purity grade.
For comparative research, repeatability and consistent sample preparation may be central. For supplier release testing, documented system suitability, reference-material use and controlled integration may be more important. For highly sensitive electronic-material research, the HPLC result may need to be reviewed together with elemental, thermal or spectroscopic data.
A Certificate of Analysis should do more than place “HPLC: 99.95%” beside a batch number. The reported value becomes substantially more useful when the document or supporting analytical report identifies the method and the tested batch clearly.
When reviewing C60 HPLC data, verify the following:
The absence of every item on this list does not automatically make a result invalid. The necessary level of detail depends on the application and quality agreement. It does, however, provide a disciplined way to distinguish a transparent analytical result from an unsupported purity number.
A higher reported HPLC purity does not by itself prove that a material will perform better in every application. It indicates that the main C60 response represents a larger proportion of the chromatographically measured components under the stated method.
The practical importance of a purity difference depends on what remains in the sample and how the material will be used. A small proportion of another fullerene may matter in a sensitive optical or electronic experiment but be less decisive in an exploratory material study. Conversely, a material with a high HPLC area percentage could still be unsuitable if the critical concern is trace metal content, residual solvent or an insoluble contaminant not represented by that chromatogram.
Researchers and technical buyers should therefore connect the analytical specification to the experiment. The correct question is not simply “Which grade has the largest number?” It is “Does the analytical package measure the attributes that can affect this particular process?”
Two suppliers may both report 99.9% C60 while using different columns, wavelengths, integration settings or purity definitions. The percentages are not necessarily directly comparable.
A technically meaningful comparison begins by confirming that both reports use equivalent analytical objectives and calculations. Review whether both samples were completely dissolved, whether the methods separate the same impurities, whether detector response was corrected, and whether the reported result represents relative HPLC area or calibrated concentration.
If the methods differ materially, the most reliable comparison may be to analyze both samples in the same laboratory using the same procedure. This removes many method-related variables and makes observed differences easier to interpret.
The Fullerene supports technical inquiries for multiple Fullerene C60 purity grades, including material intended for research, photovoltaic, electronic, formulation and industrial evaluation. To discuss a requirement, provide the target purity, quantity, application, destination and analytical documents needed for your internal review.
Request Fullerene C60 documentation and quotation details.
It generally means that C60 was separated and measured using a defined HPLC method. If the result is based on area normalization, the reported percentage represents the C60 peak area relative to the total included chromatographic peak area under that method.
Not necessarily. An HPLC area percentage is not automatically identical to total mass fraction. The interpretation depends on sample preparation, separation, detector response, integration rules and whether all relevant components are detected.
No. A large peak shows that C60 dominates the measured chromatographic response, but co-eluting compounds, undissolved material, metals, residual solvents, water or substances that do not respond to the detector may not be represented adequately.
Differences may result from sample preparation, solvent, column chemistry, mobile phase, detector wavelength, integration settings, response-factor treatment, reference materials and method validation.
The answer depends on the specification. GC or GC-MS may be used for residual solvents, ICP-MS or ICP-OES for elemental impurities, Karl Fischer titration for water, and spectroscopic, thermal or mass-spectrometric methods for complementary identity and purity assessment.
A useful report should identify the tested batch, analytical method, calculation basis, chromatogram, retention information and integrated peaks. Additional system-suitability, reference-standard or response-factor information may be required for more demanding decisions.
For B2B procurement of Fullerene C60 (Pure), 99.95% Purity, No metallic residue, buyers should confirm target purity, required quantity, application, destination country, COA, MSDS/SDS, packaging, storage conditions, and shipping requirements before requesting a formal quotation.
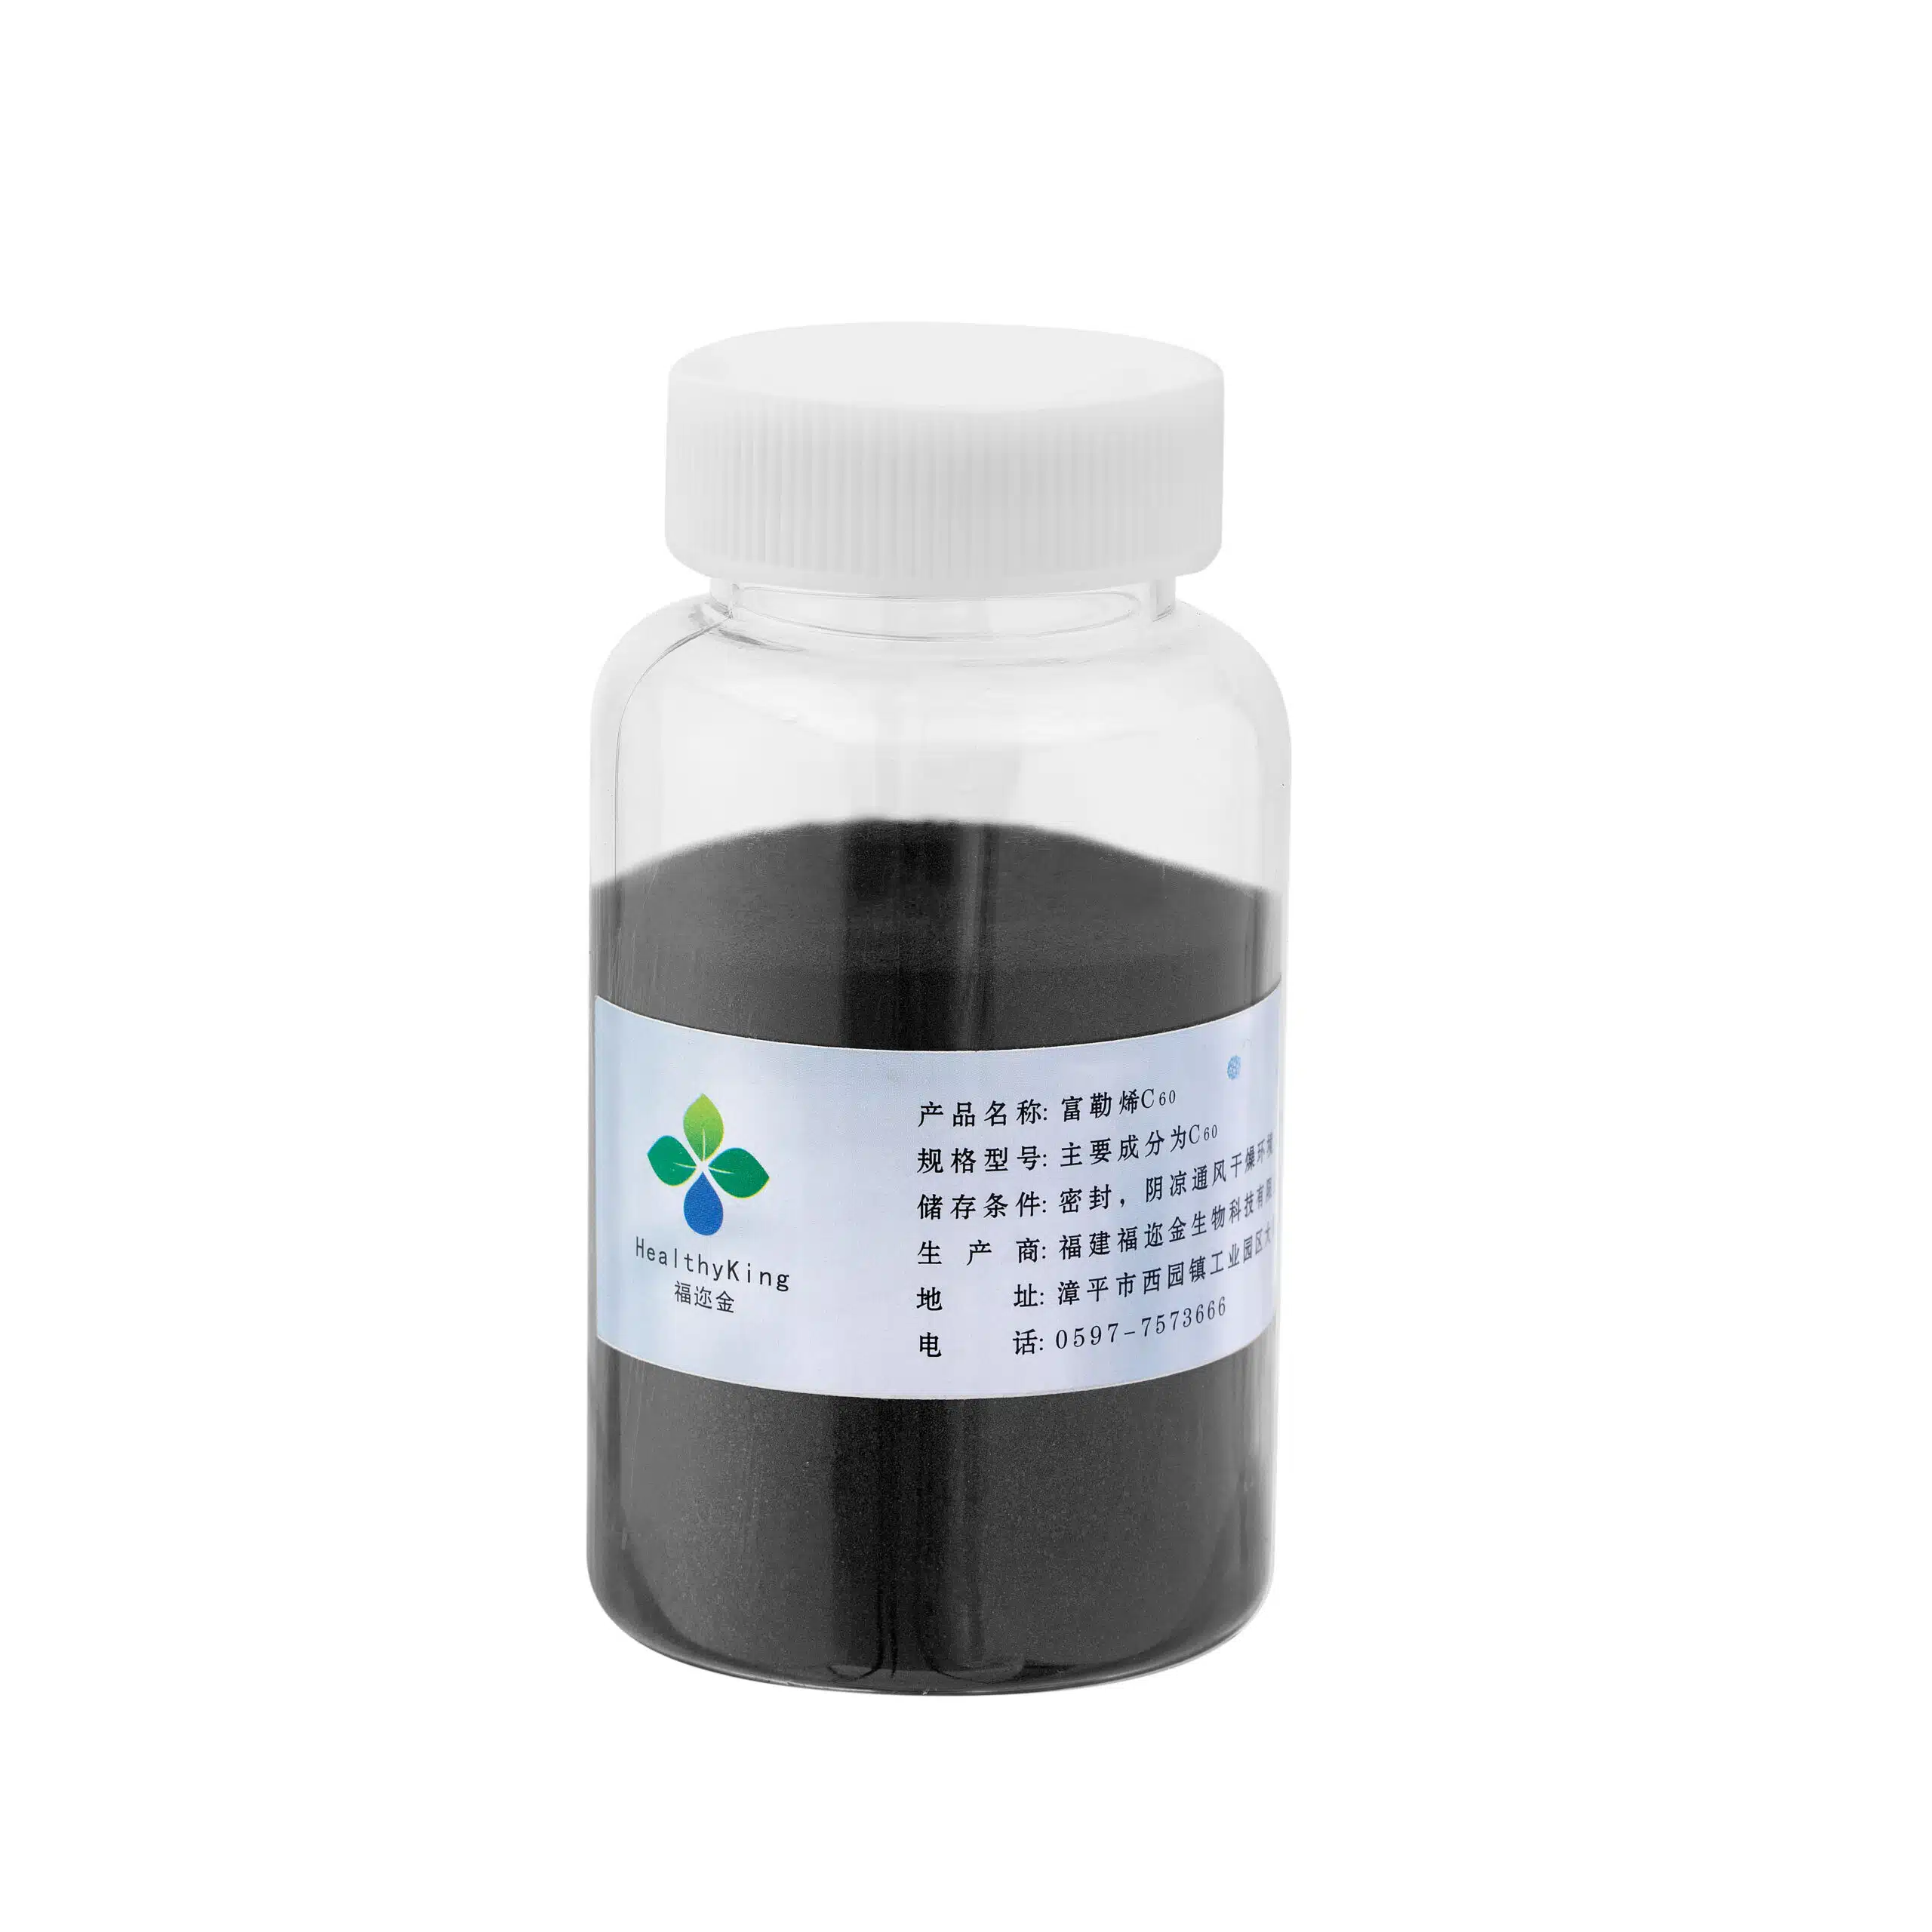
High-purity fullerene C60 is a highly refined nanomaterial designed specifically for the most demanding scientific and industrial applications. This ultra-pure form ensures…
Request product specifications, batch-specific COA, MSDS/SDS, sample availability, packaging details, and international shipping information before confirming your order.
Request DocumentsSubmit your product, purity, quantity, application, destination country, and documentation requirements. Our team will help confirm availability, COA, MSDS/SDS, packaging, and quotation details.