XCT Insights
Stay Updated
Fullerene research, applications and company updates, delivered occasionally.
Latest from XCT
View all

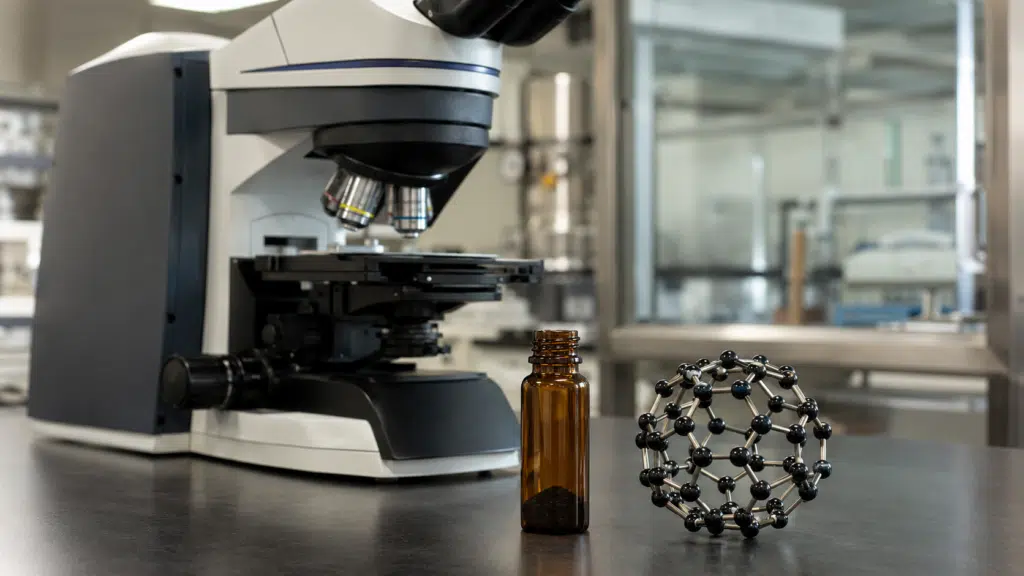
Raman spectroscopy can provide a rapid, minimally preparative view of the vibrational behavior of fullerene C60. A spectrum may help a researcher recognize characteristic C60 modes, compare a powder with a thin film, investigate changes after processing, or look for evidence that the material has undergone a structural transformation.
The method is powerful, but it is not self-interpreting. Peak position can depend on sample state and measurement conditions, while the excitation laser can heat or even photochemically alter C60. A strong characteristic band is also not equivalent to a quantitative purity result. Reliable interpretation therefore requires more than matching one peak to a reference value.
This guide explains what C60 Raman spectroscopy measures, why the Ag(2) “pentagonal-pinch” mode is important, how experimental conditions affect the spectrum, and when complementary methods such as HPLC or X-ray diffraction are required.
Raman spectroscopy measures inelastically scattered light. Most incident photons are elastically scattered, but a small fraction exchange energy with molecular vibrations. The energy difference between the incident and scattered photons is reported as a Raman shift, normally in reciprocal centimeters (cm−1).
C60 has a highly symmetric, closed-cage molecular structure. Its symmetry restricts which molecular vibrations are Raman-active. Early measurements of chromatographically separated C60 reported eight clear Raman lines and two weaker lines, establishing the fundamental Raman-active set associated with the buckminsterfullerene structure.1

These modes are commonly described as two nondegenerate Ag modes and eight fivefold-degenerate Hg modes. In an ideal isolated molecule, degeneracy means that several vibrational motions share the same energy. In real solids, films, derivatives or stressed samples, interactions and symmetry reduction can shift, broaden or split the observed features.
Raman spectroscopy is therefore sensitive to molecular vibration and local environment. It does not provide the same information as C60 X-ray diffraction, which primarily evaluates long-range crystalline order.
The best-known feature in a C60 Raman spectrum is the higher-frequency Ag(2) mode, often called the pentagonal-pinch mode. The motion involves predominantly tangential stretching of carbon atoms around the pentagonal rings of the C60 cage.
For pristine monomeric C60 under commonly reported ambient conditions, this band is frequently observed close to 1469 cm−1.2 The value should be treated as an approximate reference, not as a universal acceptance limit. Calibration, spectral resolution, temperature, pressure, substrate interaction, charge transfer, sample morphology and data processing can all affect a reported position.
The Ag(2) mode is useful because its position and shape can respond to intermolecular bonding and changes in the electronic environment. Polymerized or dimerized C60 phases have been reported to exhibit a shift of this feature toward lower wavenumber. However, a small shift should not automatically be assigned to polymerization. The researcher must first rule out calibration error, sample heating, fitting choices, strain and other matrix effects.
A peak near the expected Ag(2) position supports an assignment to C60, but it does not prove that the sample contains only C60. A minor impurity may produce a weak Raman signal, overlap with a C60 band, fluoresce, or simply fall below the method’s practical detection capability.
Interpretation is stronger when the Ag(2) feature is evaluated together with the broader C60 vibrational pattern, instrument calibration, repeated measurements and a suitable reference sample. When composition or chromatographic purity is the decision variable, C60 HPLC analysis is more directly aligned with the question.
A Raman spectrum should always be interpreted in the context of the physical form measured. C60 powder, a single crystal, a solution, a vacuum-deposited film and a C60-containing composite do not necessarily produce identical spectra.
| Sample form | Important interpretation factors |
|---|---|
| Powder or crystal | Particle orientation, crystal phase, pressure, local heating and sampling heterogeneity |
| Solution | Solvent bands, concentration, fluorescence, aggregation and possible chemical change |
| Thin film | Film thickness, substrate background, morphology, deposition history and ambient exposure |
| Composite or device layer | Matrix bands, charge transfer, interfacial effects, low C60 loading and spectral overlap |
| Processed or polymerized material | New intermolecular bonds, reduced molecular symmetry, peak shifts, splitting and broadening |
For example, a spectrum collected from a thin C60 coating may contain substrate features that are absent from the powder. A composite can show overlapping bands from the host polymer or semiconductor. A solution measurement can introduce solvent peaks or fluorescence. These differences do not by themselves indicate poor material quality; they may reflect the measurement environment.
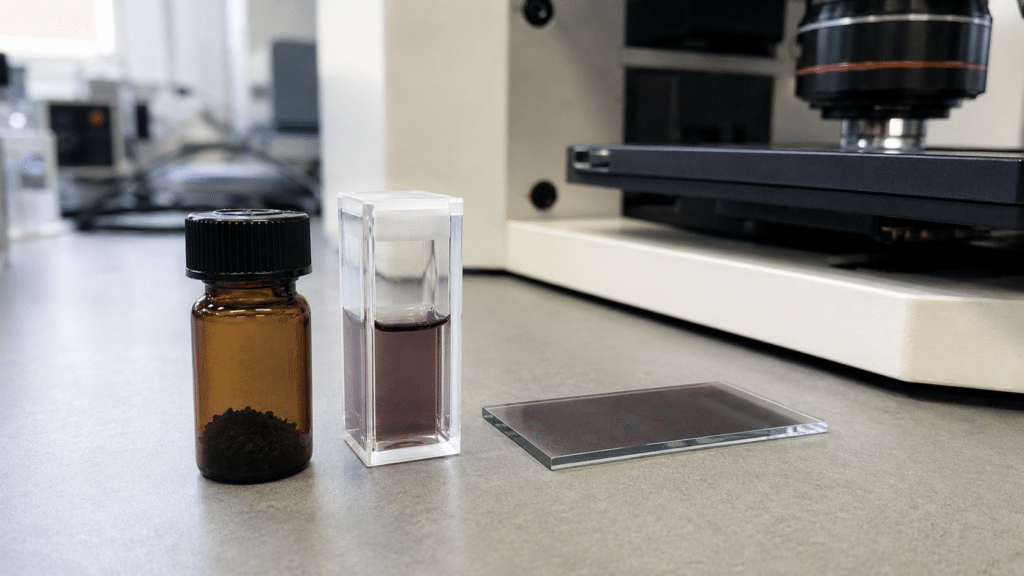
When comparing incoming material with a processed film, retain an unprocessed reference from the same material lot if the experimental design permits. That comparison helps separate material-related differences from changes introduced by deposition, annealing, illumination or device fabrication. Researchers working with deposited layers may also consult XCT’s guide to thermal evaporation of C60 thin films.
A Raman spectrum cannot be evaluated independently of its acquisition conditions. At minimum, a report should identify the excitation wavelength, approximate power at the sample, objective, acquisition time, number of accumulations, spectral resolution and calibration procedure.

Excitation wavelength affects Raman scattering efficiency, fluorescence background, optical penetration and the risk of photochemical change. Visible excitation can provide strong signals, but C60 can absorb light in ways that make laser-induced effects relevant.
In an in situ high-pressure study, researchers used 830 nm excitation to reduce interference from photoinduced polymerization that had complicated measurements made with shorter-wavelength lasers.2 That result does not mean 830 nm is the only valid wavelength for routine analysis. It demonstrates why wavelength must be reported and why the measurement should be checked for laser-dependent changes.
The instrument’s nominal laser power is not the entire story. Power density at the sample also depends on objective magnification, numerical aperture, spot size, focusing and attenuation. A small, tightly focused spot can expose the sample to substantial local power density even when the displayed laser power appears modest.
Local heating may shift or broaden Raman bands. It may also change the sample physically or chemically. A prudent measurement begins at low power and short exposure, then increases the signal only after confirming that repeated spectra from the same location remain stable.
Long integrations and multiple accumulations improve the signal-to-noise ratio, but they also increase total exposure. Compare an initial spectrum with later scans collected from the same point. A progressive change in the Ag(2) region, the appearance of new bands, increased background or visible alteration of the measurement spot can indicate that the analysis is affecting the sample.
Photoinduced polymerization of solid C60 films has been reported in peer-reviewed research.3 Under suitable conditions, neighboring C60 cages can form intermolecular bonds. This transformation reduces molecular symmetry and changes the Raman response, including the behavior of the Ag(2) mode.
This creates a particularly important analytical risk: the spectrum may appear to reveal a transformed material when the transformation was partly induced during measurement.
To test for this possibility:
These controls are especially relevant for films, pressure experiments and samples intentionally investigated for dimerization or polymerization.
A Raman spectrum contains more information than a list of peak positions. Three features should be considered separately.
Position reflects vibrational energy. A shift can be associated with changes in intermolecular bonding, pressure, strain, temperature, charge state or surrounding matrix. Before assigning chemical meaning to a small shift, confirm wavelength calibration and compare equivalent sample forms under equivalent conditions.
Broadening can reflect heterogeneous environments, disorder, unresolved overlapping components, reduced vibrational lifetime or instrumental resolution. Peak splitting can occur when degeneracy is lifted by reduced symmetry or when more than one molecular state contributes to the measurement.
Peak fitting can help separate components, but fitted peaks must not be treated as automatically real. Baseline selection, line-shape model, fitting range and constraints should be documented. An unstable fit is not strong evidence for a new phase.
Intensity depends on more than concentration. Excitation wavelength, molecular orientation, focusing, optical alignment, substrate enhancement, resonance effects and detector response can all change relative band strength. For that reason, spectra collected on different instruments or under different geometries should not be quantitatively compared without suitable normalization and controls.
Raman spectroscopy can support molecular identification and detect some conspicuous changes or Raman-active contaminants. It should not normally be used as the sole numerical test of C60 purity.
A clean-looking spectrum does not establish a percentage purity because different substances have different Raman responses, and trace components may not produce detectable independent bands. Conversely, an unexpected band might originate from a substrate, solvent, container, environmental contamination or processing residue rather than another fullerene.
The analytical method should match the specification question:
XCT’s overview of C60 characterization methods explains why these methods should be treated as complementary rather than interchangeable.
C70 has lower molecular symmetry than C60 and consequently presents a more complex vibrational spectrum. A spectrum containing the characteristic C60 pattern may therefore be distinguished from a well-resolved C70 spectrum, but mixtures require care. Overlapping signals, different scattering efficiencies and low component concentration can make visual comparison unreliable.
Chemically modified C60 derivatives can retain cage-related bands while also displaying new features from attached functional groups. Shifts or intensity changes can arise from functionalization, charge transfer or the surrounding matrix. Raman results should therefore be interpreted against a reference that matches the chemical form under investigation—not merely against pristine C60 powder.
For an introduction to the molecular identity and structure of the material, see what fullerene C60 is.
A technically useful report allows another researcher to understand both the sample and the measurement. It should identify the sample form and substrate, excitation wavelength, power or attenuation at the sample, objective, acquisition time, accumulations, spectral range, resolution, calibration reference, baseline treatment and any peak-fitting method.
The report should also state whether repeat scans were stable and whether multiple locations were measured. For heterogeneous powders, films or composites, a single point may not represent the entire specimen.
When reviewing supplier or third-party data, do not evaluate only whether a band appears near 1469 cm−1. Check whether the acquisition conditions, sample form and comparison reference are disclosed. Without that context, a close numerical match can create more confidence than the evidence supports.
Raman spectroscopy is most valuable when the analytical question is defined before measurement. If the question is “Does this specimen show the expected vibrational pattern of C60?”, Raman can be highly informative. If the question is “Did processing alter the molecular state?”, controlled before-and-after spectra may reveal shifts, broadening or new features. If the question is “Is this material 99.9% pure?”, another method must carry the quantitative burden.
Researchers evaluating fullerene C60 material can contact XCT with the intended sample form, analytical workflow and application context. XCT can discuss available product information without treating a single Raman spectrum as a substitute for application-specific validation.
Submit a technical request or contact XCT to discuss C60 requirements for research, thin-film or advanced-material development.
The best-known C60 Raman feature is the Ag(2) pentagonal-pinch mode, commonly observed near 1469 cm−1 for pristine monomeric C60 under ambient conditions. Its exact position can vary with calibration, sample state and measurement conditions.
No. Raman spectroscopy can support molecular identification and reveal some contaminants or structural changes, but it does not normally establish a numerical C60 purity by itself. HPLC and other complementary methods should be selected according to the impurity or specification being evaluated.
The Ag(2) peak can shift because of intermolecular bonding, polymerization, pressure, strain, temperature, charge transfer, substrate interaction or calibration differences. A small shift should be confirmed with controls before it is assigned to a chemical transformation.
Yes. Depending on wavelength, power density, exposure and sample form, laser illumination can heat C60 or contribute to photochemical change, including photoinduced polymerization reported in solid C60 research. Low-power tests and repeat scans help identify this risk.
Not necessarily. Substrate background, morphology, crystal environment, strain, processing history and laser interaction can make a thin-film spectrum differ from a powder spectrum. Comparisons should use equivalent acquisition conditions and an appropriate reference.
For B2B procurement of Fullerene C60 (Pure), 99.95% Purity, No metallic residue, buyers should confirm target purity, required quantity, application, destination country, COA, MSDS/SDS, packaging, storage conditions, and shipping requirements before requesting a formal quotation.
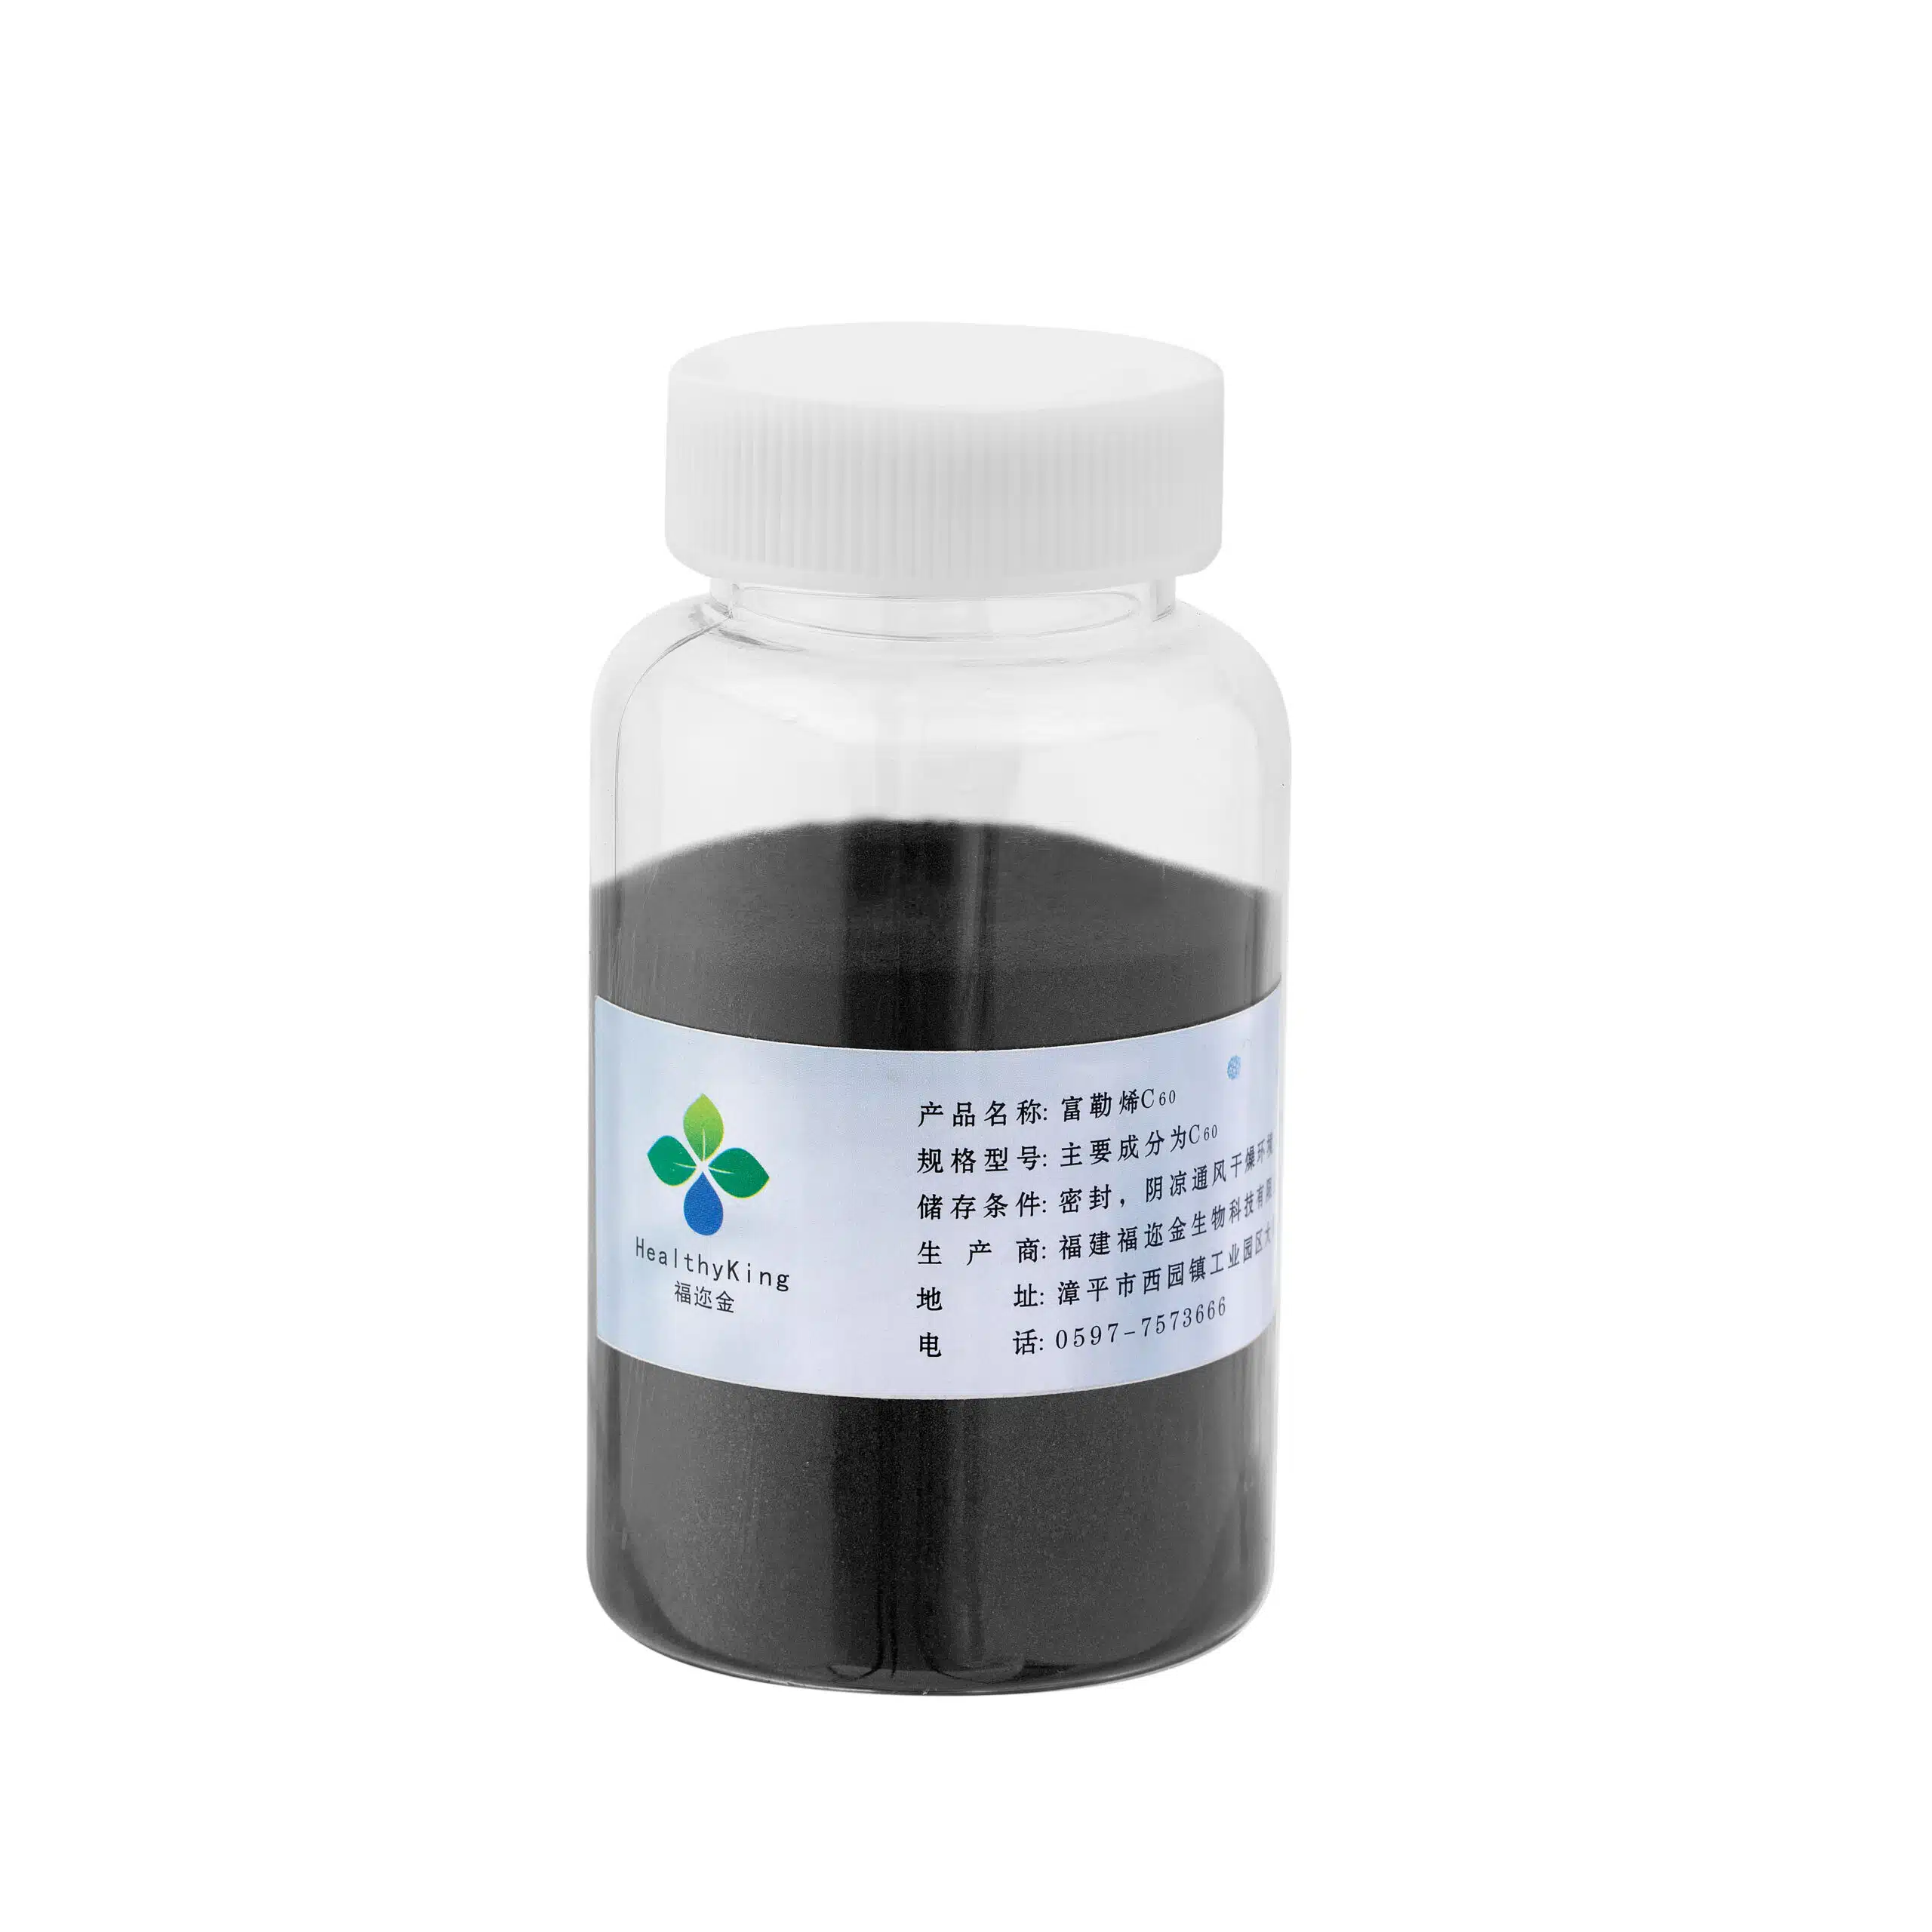
High-purity fullerene C60 is a highly refined nanomaterial designed specifically for the most demanding scientific and industrial applications. This ultra-pure form ensures…
Request product specifications, batch-specific COA, MSDS/SDS, sample availability, packaging details, and international shipping information before confirming your order.
Request DocumentsSubmit your product, purity, quantity, application, destination country, and documentation requirements. Our team will help confirm availability, COA, MSDS/SDS, packaging, and quotation details.